Revenue Architecture Is the Model. Now There's an Engine to Run It.
Most revenue platforms draw a line from lead to Closed Won and call it a day. Everything after that — onboarding, value delivery, expansion, renewal — lives in a different system, a different team’s spreadsheet, or nowhere at all. The result is a blind spot so pervasive that 95% of SaaS finance leaders say technology gaps block their order-to-cash effectiveness, with over half calling those gaps “severe.”
The Bowtie model, popularised by Winning by Design and their Revenue Architecture textbook, recognised this problem years ago. It extended the traditional funnel past the close, mapping the full customer journey from acquisition through retention and expansion. Over 2,000 GTM executives have now been certified in the framework. The model is sound. But for most teams, it remains exactly that — a model. A framework on a whiteboard. A chapter in a textbook.
The gap has never been conceptual. Revenue leaders understand that delivery feeds acquisition, that renewals fund growth, that the post-sale lifecycle is where compounding revenue lives. The gap is operational: there has been no single system that connects outreach through pipeline execution, deal commitment, customer onboarding, value evidencing, expansion, and renewal into one instrumented view. Until now.
This is the story of how we built Summit53’s Revenue Engine — and why it matters for every B2B SaaS team that has outgrown gut-feel forecasting but can’t justify enterprise tooling to replace it.
The Linear Funnel Is Broken
The standard sales funnel served its purpose when software was sold once and maintained forever. But recurring revenue changed the economics fundamentally. In a SaaS business, the initial close is just the beginning of the revenue relationship. Net Revenue Retention — the metric that separates good SaaS from great SaaS — depends entirely on what happens after the deal closes.
Yet the tools most teams use still reflect the old model. CRM platforms are built as systems of record for sales activity, not systems of intelligence for the full revenue lifecycle. They can tell you how many emails a rep sent, but not whether a customer is realising the value they were promised. Pipeline dashboards show where deals sit today, but not how they flow, how long they’ve been idle, or where the structural bottlenecks are.
The numbers paint a stark picture. The average SaaS growth rate has dropped to 18%, with 35% of companies reporting year-over-year declines. Only 11–30% meet the Rule of 40. Meanwhile, 78% of sellers missed quota in 2025. These are not problems that another pipeline dashboard will solve. They are symptoms of a fundamental disconnect between how revenue actually works and how teams instrument it.
Revenue is not a funnel. It is a loop. And running a loop requires an engine, not a set of disconnected gauges.
From Revenue Architecture to Revenue Engine
Two terms matter here, and they mean different things.
Revenue Architecture is the conceptual model. It describes how the stages of a recurring revenue business connect: acquisition feeds the pipeline, the pipeline produces closed deals, closed deals enter onboarding, onboarding leads to value realisation, value evidence drives expansion, expansion feeds renewal, and successful delivery generates the referrals and case studies that fuel the next wave of acquisition. Winning by Design codified this as the Bowtie model. The broader community has built on it. It is the right way to think about revenue in a SaaS business.
A Revenue Engine is what makes that architecture operational. It is the system that actually connects these stages in a single data model, instruments each transition, and surfaces the signals that tell you where the loop is healthy and where it is breaking down. An architecture is a blueprint. An engine is the thing that runs.
Summit53’s Revenue Engine operationalises the full revenue architecture in two complementary views. The Bow-Tie view maps the linear progression from acquisition through pipeline to delivery — the stages most teams are familiar with, laid out left-to-right with conversion rates and deal values at each stage. The Figure-Eight view goes further: it visualises revenue as a continuous, self-reinforcing cycle where delivery and growth loop back into acquisition. This is not a metaphor. It is a working system where every stage is instrumented with real data.
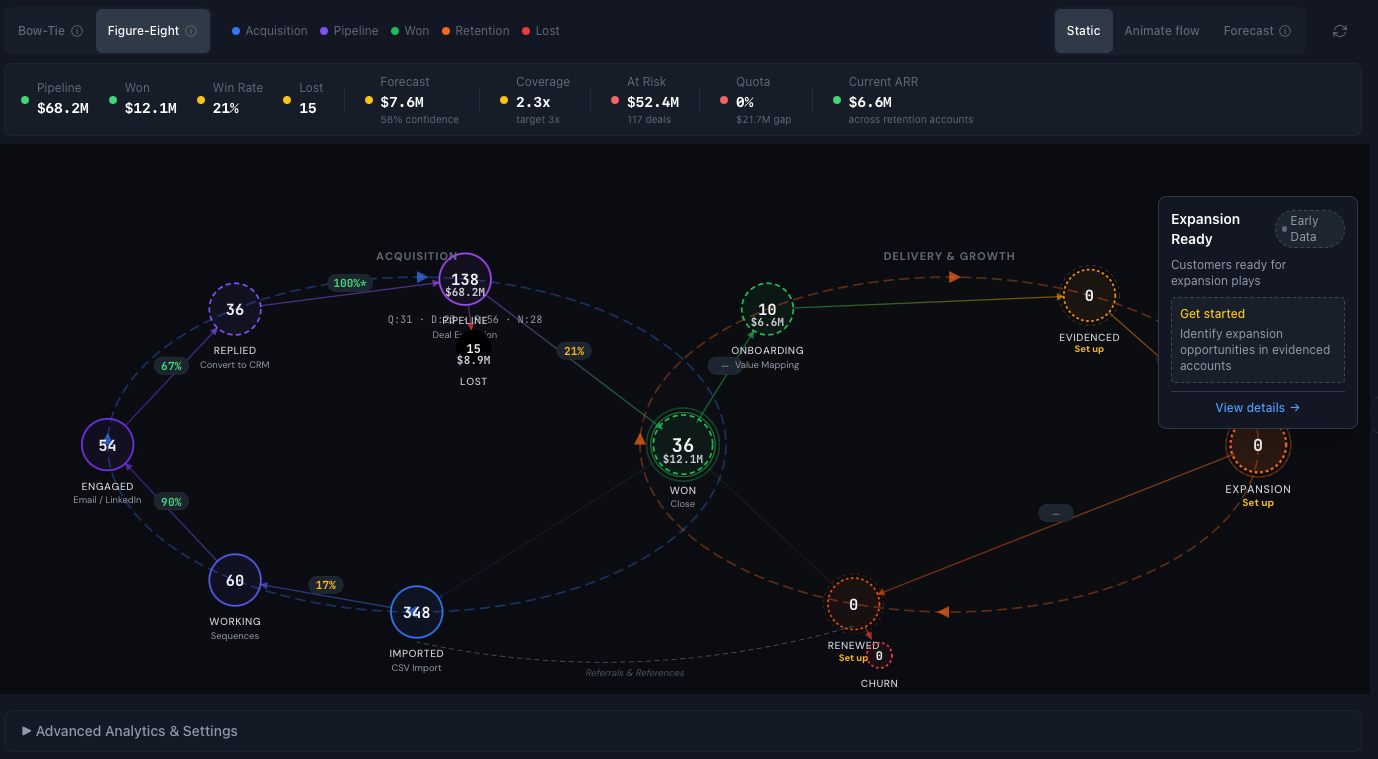
The Figure-Eight Revenue Engine. Acquisition stages flow left-to-right through the pipeline, then loop through delivery, expansion, and renewal — with referrals feeding back into acquisition. Every number is live CRM data, not a static diagram.
The numbers in the Figure-Eight are not illustrations. They are live: 348 imported leads, 60 working sequences, 54 engaged via email and LinkedIn, 36 replies converted to CRM, 138 deals in the pipeline worth $68.2M, 36 won at $12.1M, 10 in onboarding at $6.6M. The conversion percentages between stages (17% imported-to-working, 90% working-to-engaged, 67% engaged-to-replied, 100% replied-to-pipeline, 21% pipeline win rate) are calculated in real time. When a deal moves, the engine updates.
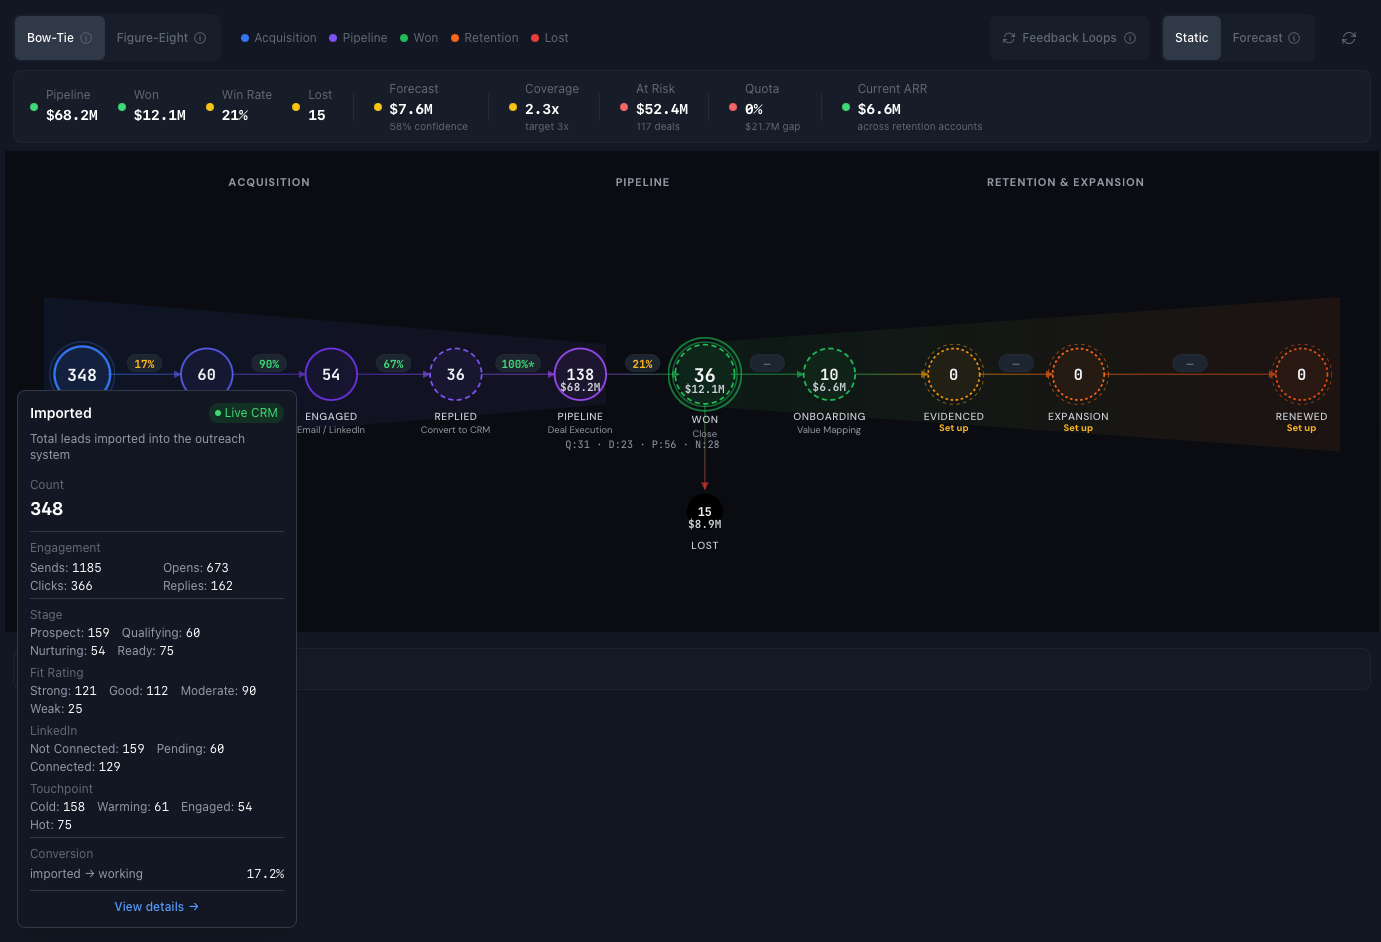
The Bow-Tie view of the same data. The linear progression makes stage-by-stage conversion rates immediately visible, with pipeline deal execution broken down by qualification framework scores (Q:24 · D:18 · P:54 · N:42). Feedback loops are shown as dashed lines connecting delivery back to acquisition.
What makes this different from a standard pipeline dashboard is scope. Most tools show you a slice — Clari shows pipeline and forecast, Gong shows conversations, outreach tools show sequences. The Revenue Engine connects all of these into one continuous view. The acquisition side (leads, sequences, engagement, replies) flows directly into the pipeline side (deal execution, framework scoring, forecast), which flows into the delivery side (onboarding, value tracking, expansion, renewal). You see the whole loop, not a fragment.
Pipeline as Flow, Not Snapshot
A pipeline dashboard tells you where deals sit. It does not tell you how they move — or more importantly, where they stop moving. This is the difference between a photograph and a film. The photograph shows 138 deals in the pipeline. The film shows that 48 of them are stalled, 78 are at risk, and the average deal has been idle for 35 days since last activity.
Summit53’s Pipeline Velocity view provides that film. Each deal is rendered as a horizontal bar in a swimlane, grouped by stage. The length of the bar represents days since last activity. The height represents deal value. The colour represents waste score — a composite metric that captures how much pipeline value is tied up in deals that aren’t progressing. Green means active. Gold means ageing. Red means stalled.
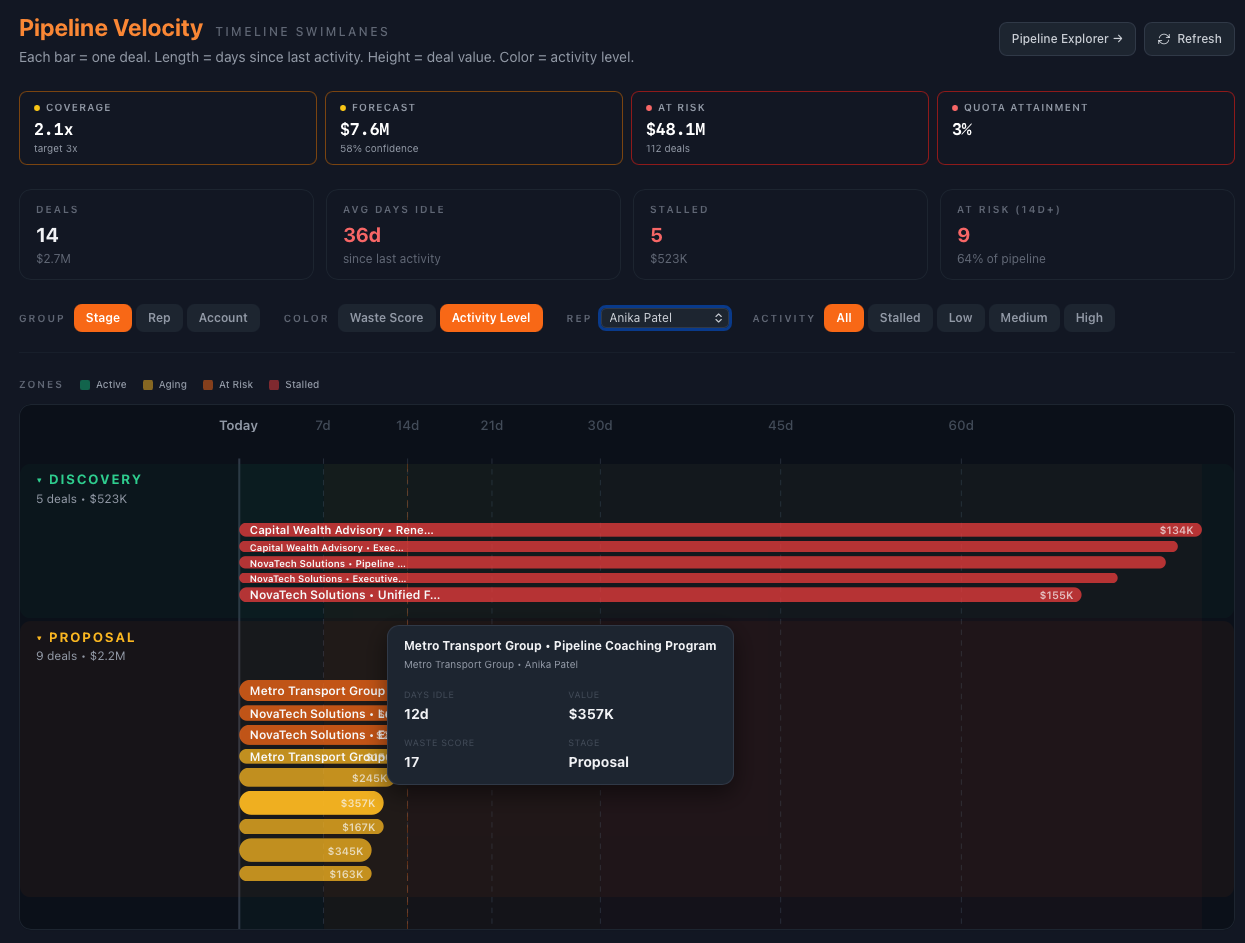
Pipeline Velocity swimlanes. Each bar is a deal. Length = days idle. Height = value. Colour = waste score. The Qualification stage shows 24 deals worth $1.6M, mostly active (green). Discovery shows 18 deals at $2.1M — overwhelmingly stalled (red), with many idle for 30–60+ days. At a glance, you see where pipeline velocity has collapsed.
The summary metrics across the top tell the story before you even look at individual deals: $7.6M forecast at 58% confidence, $65.1M at risk across 128 deals, 0% quota attainment. Underneath: 35 days average idle, 48 stalled deals worth $27.4M, 78 deals at risk representing 57% of the pipeline. No other platform in the revenue intelligence category offers this kind of time-based, waste-scored deal visualisation. It is not an incremental improvement on a pipeline grid. It is a fundamentally different way to see pipeline health.
Where Pipeline Velocity shows time-based health, the Pipeline Explorer shows structural flow. It renders the pipeline as a Sankey diagram — configurable multi-dimensional flows that reveal how deals distribute across any combination of dimensions. The view below maps Forecast Category to Health Band to Rep, showing exactly where pipeline value concentrates and where risk clusters.
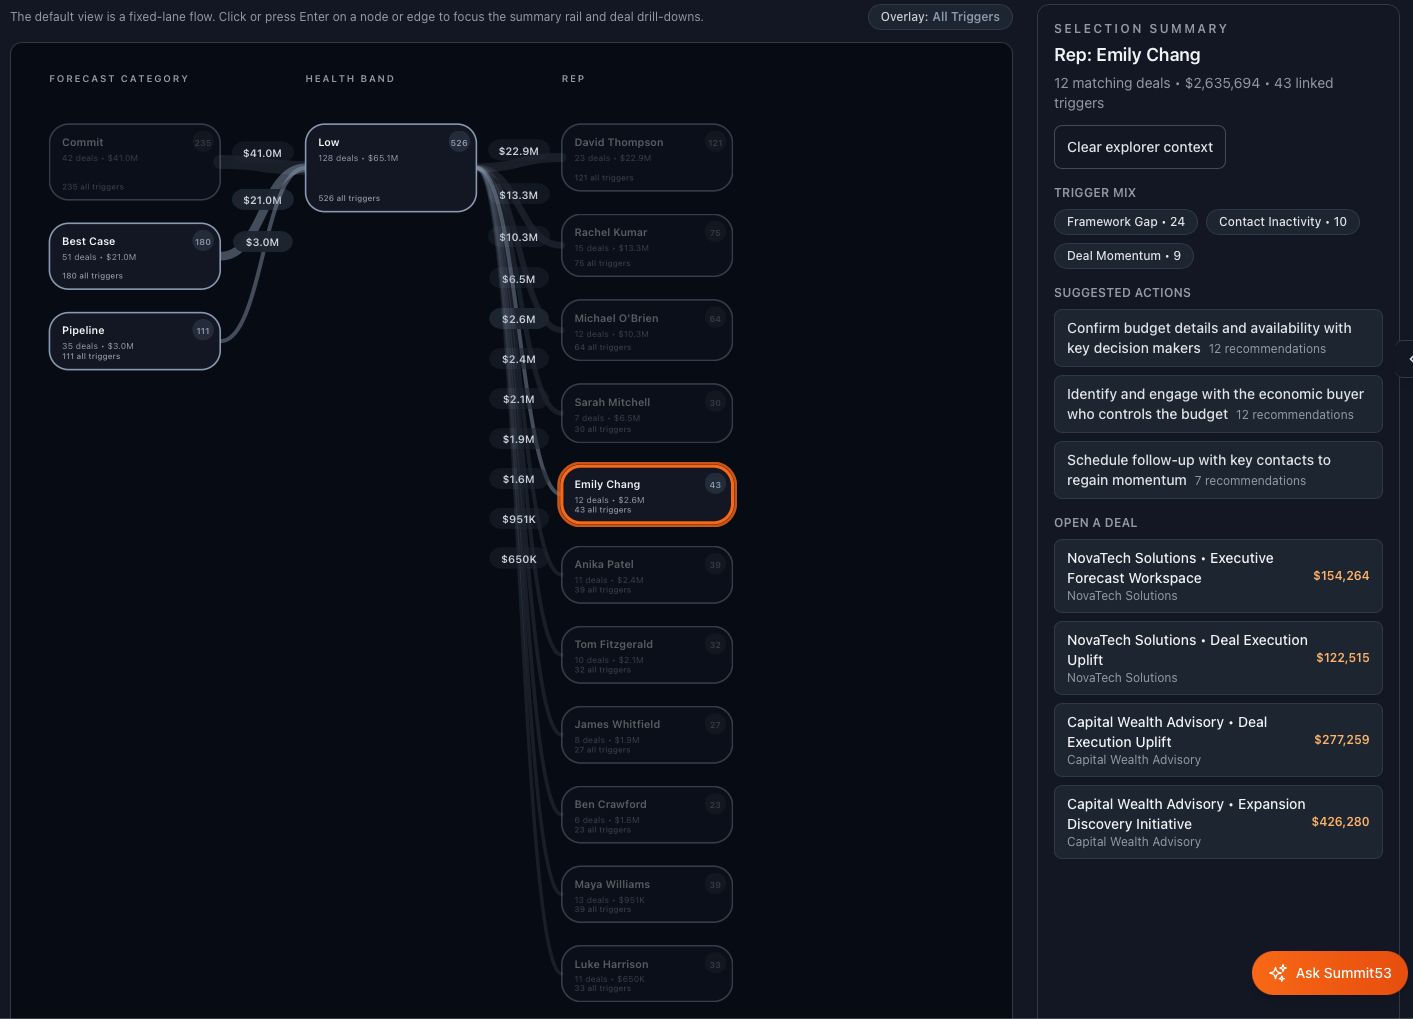
Pipeline Explorer Sankey flow. Forecast Category → Health Band → Rep. The width of each flow represents deal value. Here, $41M in Commit and $21M in Best Case both flow through the “Low” health band — a structural risk that a standard pipeline view would never surface.
The Sankey reveals something a pipeline list never could: $65.1M across 128 deals sits in the Low health band, including $41M that is categorised as Commit. That is a forecast risk that no amount of deal-by-deal review would efficiently surface. The Explorer makes structural patterns visible — which reps carry the most risk, which forecast categories are hollow, where trigger clusters indicate systemic issues rather than individual deal problems.
The Missing Half — What Happens After Closed Won
Here is a question most revenue platforms cannot answer: are your customers getting the value they were promised?
It is not a philosophical question. It is the question that determines whether a customer renews, expands, or churns. It is the question that determines Net Revenue Retention. And it is the question that the vast majority of revenue tools ignore entirely, because their data model ends at Closed Won.
Summit53’s Revenue Engine includes the post-sale lifecycle as a first-class citizen, not an afterthought. The delivery side of the Figure-Eight tracks onboarding progress, value contract fulfilment, evidence capture, expansion readiness, and renewal health. Value contracts connect pre-sale promises to post-sale outcomes with auto-captured evidence. When a customer was told they’d see an 18% improvement in forecast accuracy and the system measures that improvement, that evidence is captured, attributed, and available for expansion conversations and renewal justification.
This is the feature that makes the Figure-Eight model real rather than theoretical. Without post-sale tracking, the “loop” is just a diagram. With it, delivery genuinely feeds back into acquisition: evidenced value becomes case study material, successful expansions become referral sources, and renewal confidence feeds into ARR forecasting. No other platform in the $7–25M ARR segment connects deal execution to post-sale value tracking to expansion readiness scoring in a single system.
Acquisition in Real Time
The Revenue Engine does not start at the pipeline. It starts at first touch. The acquisition side tracks leads from import through outreach sequences, engagement, and reply — all the way to pipeline conversion. Every lead has a stage, a fit rating, a next action, and a last touch date.
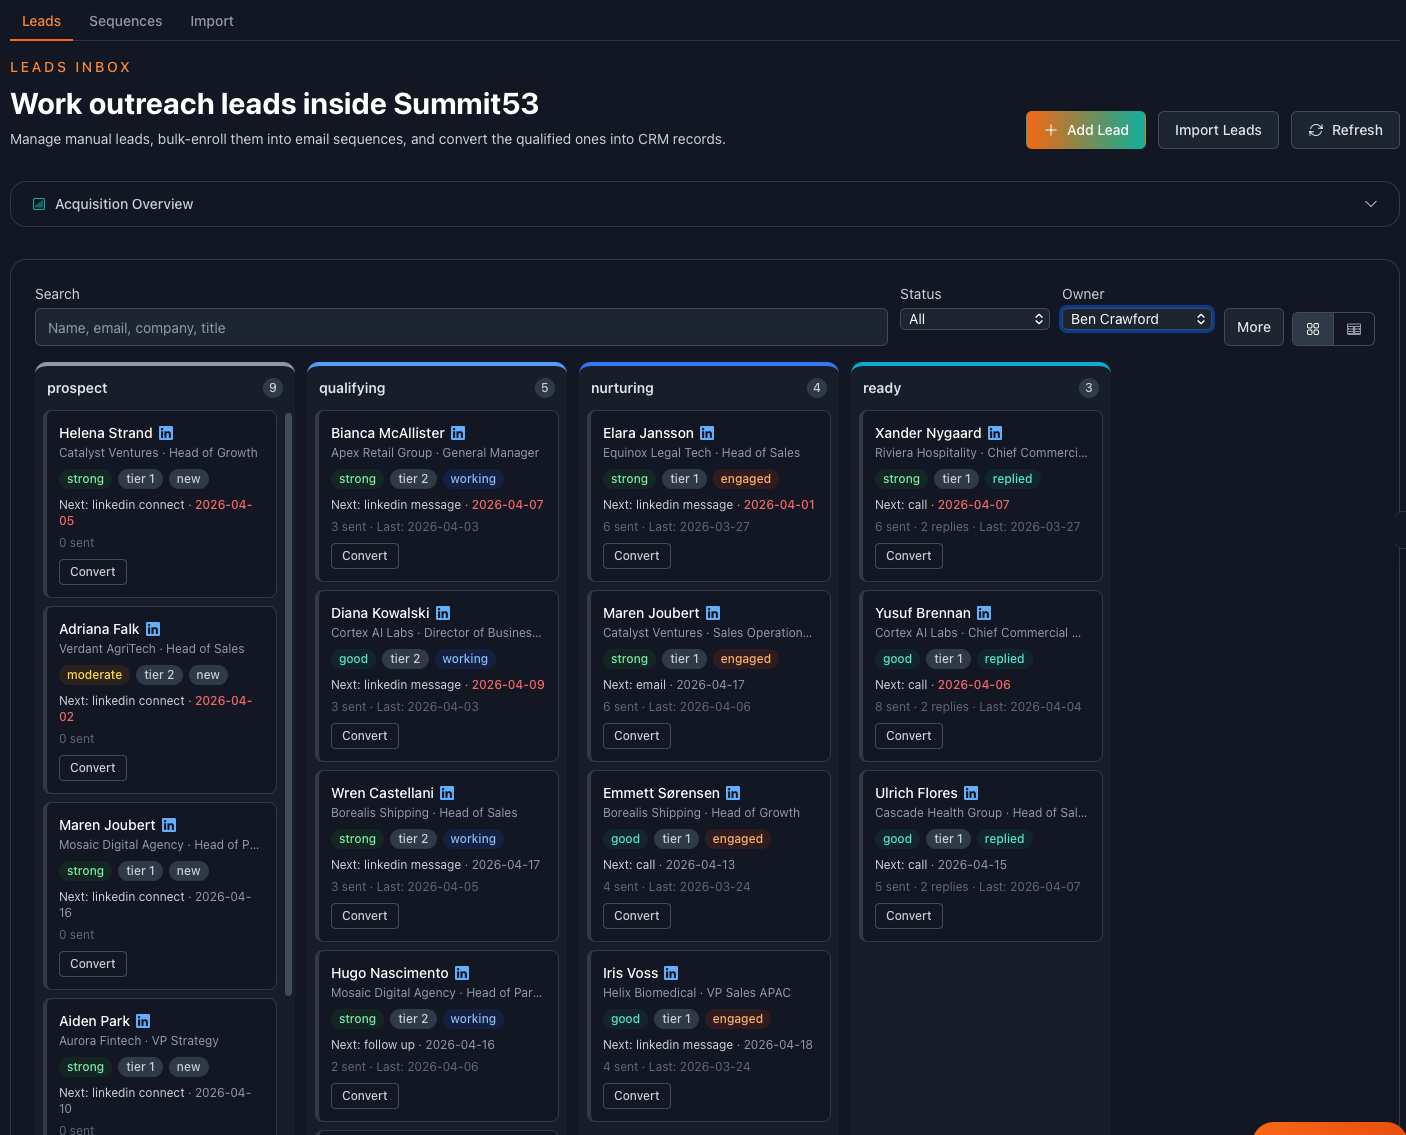
The Leads Inbox. 105 prospects, 60 qualifying, 54 nurturing, 36 ready to convert. Each card shows fit rating, engagement tier, next action date, and message history. When a lead hits “Ready,” one click converts them into a CRM opportunity — and they appear in the Revenue Engine’s pipeline automatically.
What matters here is continuity. A lead imported from CSV flows through outreach sequences, gets qualified against ICP criteria, engages via LinkedIn or email, replies, converts to a CRM opportunity, enters the pipeline, gets scored against MEDDPIC, BANT, or SPICED, closes, enters onboarding, and eventually either renews, expands, or churns — and every one of those transitions is visible in the Revenue Engine. There is no handoff gap. There is no stage where the data disappears into a different system.
This is what “end-to-end” means in practice. Not a marketing claim. A data model that spans the full lifecycle.
Why This Matters for $7–25M ARR Teams
If you are running a B2B SaaS company between $7M and $25M ARR, you know the in-between feeling. You have outgrown the spreadsheet-and-CRM approach to pipeline reviews. Your forecast calls are debates, not decisions. You know you need better pipeline intelligence. But the options feel binary: enterprise tools that cost more than your entire sales team, or point solutions that each solve one piece of the puzzle.
Consider the landscape. Clari’s core platform runs $100–125 per user per month (USD), with bundled modules pushing costs to $400–500 per user — and it requires significant RevOps infrastructure to implement. Gong charges approximately $1,600 per user per year plus mandatory platform fees ranging from $5,000 to $50,000 annually. Both platforms were architected for 1,000+ employee organisations and require 140+ hours of admin setup. Vasco, the closest competitor on lifecycle breadth, starts at $250 per month but operates as an analytics overlay — it visualises the Bowtie model but does not execute deals, track value delivery, or manage outreach.
Summit53’s Revenue Engine starts at NZ$39 per user per month (approximately US$23). The Enterprise tier at NZ$99 includes Pipeline Velocity, Pipeline Explorer, framework scoring, and the full Revenue Engine visualisation. The Ultimate tier at NZ$130 adds Value Impact tracking and expansion readiness. At every tier, you are getting the full lifecycle — not a slice.
The question is not whether mid-market teams deserve the same revenue intelligence as $50M+ ARR companies running Clari. They do. The question is whether that intelligence needs to come with enterprise pricing, enterprise complexity, and enterprise implementation timelines. We built Summit53 to prove it does not.
Getting Started
Revenue Architecture describes how a recurring revenue business should work. Summit53’s Revenue Engine is how you run it — connecting every stage from first touch to renewal in a single, evidence-based view.
If you have been drawing Bowtie models on whiteboards and wishing you could see the actual numbers flowing through them, that is exactly what the Revenue Engine does. If your pipeline reviews feel like status updates instead of coaching conversations, Pipeline Velocity and the Explorer will change how you see your deals. And if you have ever lost a renewal because nobody tracked whether the customer got what they were promised, the Value Impact loop is built for that moment.
Summit53 offers an 8-day free trial with no setup consultants and no credit card required. Connect your CRM, and the Revenue Engine populates within minutes. For teams that want to help shape what comes next, our Founding 50 programme partners with the first 50 revenue teams to run on Summit53 — founder access, permanent pricing, and direct roadmap input, in return for real deals on the platform and biweekly feedback. A partnership, not a discount.
If you would like to see how this works for your pipeline, get in touch.