Beyond NRR: Why Segment-Level Gross Retention Is the Metric That Predicts Churn
Most boardrooms get one retention number. It usually flatters. Net revenue retention bundles expansion, contraction, and churn into a single percentage that, in a healthy growth year, lands somewhere north of 110%. The slide nods, the meeting moves on. Then a quarter later a renewal misses, and nobody saw it coming. The number that would have seen it coming sits one click away in most CRMs, and almost nobody looks at it: gross revenue retention, broken out by segment.
This article is about why splitting gross revenue retention by segment is the single highest-leverage change a mid-market revenue leader can make to their retention reporting in 2026, what the current benchmarks actually say, and what an operational view of the metric looks like inside a working revenue engine.
The retention number that lets your team hide
AJ at Glean made the contrarian case on the 20VC podcast earlier this year. You get active users right, GRR is just an afterthought, he argued (roughly 32:56 in). His point is real: gross revenue retention is a lagging measure of something that has already happened. The leading instrumentation that actually predicts retention is time-to-launch and active-seat percentage. Fix those, the lagging number takes care of itself.
He is right, and the implication is sharper than it looks. If gross revenue retention is lagging, then a blended GRR number is twice lagging. It tells you, after the renewal cycle, what happened on average across an entire book. By the time it dips, the team that lost the account is six months past the moment they could have intervened. Splitting GRR by segment is what turns the lagging number into something closer to leading. It does not replace the leading indicators AJ describes. It tells you where to point them.
A 35-point gap between NRR and GRR is hiding 14.5 percentage points of base churn every twelve months. If your expansion motion slows for one quarter, that gap becomes the forecast. The conversation everyone avoids until it is too late is the segment-level conversation about where the gap is concentrated.
What the 2026 benchmarks actually say
The current B2B SaaS picture is more uneven than the headline averages suggest. The 2026 figures from SaaS Capital’s private-SaaS benchmarking survey give a usable shape, with the caveat that any single benchmark is a function of its sample — public-SaaS-skewed samples, venture-portfolio samples, and bootstrapped-survey samples produce meaningfully different headlines.
- NRR median is 103%, with the 90th percentile at roughly 118%. The typical company is barely expanding; the strong compounders are a thin top decile, not the middle of the pack.
- GRR median is 91%, with the 90th percentile at 100% — zero net dollar churn on the base. The distance from a median retainer to a top-decile one is about nine points of base revenue every year.
- At the median, the NRR–GRR gap runs around 12 percentage points. A healthy gap is considered 15 to 25 percentage points. A gap wider than 25 points, especially with NRR above 120% and GRR below 85%, is a warning — growth is being carried by a small number of expanding accounts while logos churn underneath.
- The published medians are blended. SaaS Capital’s 2026 sample is private SaaS companies in the $3M to $20M ARR band, reported as a single median NRR and a single median GRR with no split by ACV tier, segment, or go-to-market motion — and the medians are essentially flat year-over-year even as growth rates fell. That blending is the problem this article is about: one headline number hides the segment where the leak actually lives.
Set that against a typical mid-market SaaS company at $5M to $25M ARR. A blended GRR of 86% looks unremarkable, a few points under the median. Split it by segment and the picture often inverts: an enterprise book at 96% GRR sitting alongside a mid-market book at 76%. The blended number is the weighted average. The structural problem is the mid-market book. The renewal you are about to lose is on the mid-market book.
Becca Linquist described what a great-but-narrow retention picture looks like on the 20VC podcast in June: Clay had not churned a customer and was running close to 200% NDR. She named that as the green flag that screened her into the company. It is a frontier hypergrowth number; it is not a mid-market benchmark. But the implication for everyone else is the same. The question is not whether your blended retention number is north of a benchmark. The question is whether you can describe, by segment and with evidence, where the durable retention is and where the leak is.
Why blended GRR isn’t enough — the segment drag pattern
Chad Peets, on the same 20VC episode (roughly 30:36), described the mechanic with brutal economy. You booked $100,000, they’ve consumed $50K — now the account’s at risk. A rep paid on bookings will over-book the deal. A year later you have churn and no expansion. The booking becomes next year’s GRR drop.
That mechanic does not distribute evenly. It concentrates in segments where the value-realisation gap is largest. Enterprise customers tend to have professional services engagement, executive sponsorship, and a dedicated CS counterpart. Their value-realisation gap is smaller, so their GRR is higher. Mid-market customers buy the same product without the wrapper. Their value-realisation gap is wider, so their GRR is lower. The blended number averages both and hides the structural difference.
The arithmetic is unforgiving. A company with an enterprise segment at 100% GRR ($10M ARR) and a commercial segment at 75% GRR ($9M ARR) produces a blended GRR around 88%. That blended number sits just under the 2026 median. Everything looks fine. What is actually happening is the commercial segment losing a quarter of its base value every twelve months, masked by the enterprise segment carrying the average. The right intervention is on the commercial book. The blended number will never tell you that.
GRR is the bowtie’s right side, not a CS metric
The category language for this is Revenue Architecture, the model popularised by Winning by Design’s Bowtie. The Bowtie reframes the funnel: the left side is acquisition (lead, qualify, close), the right side is retention and expansion (onboard, adopt, renew, expand). The point of the model is that the customer journey does not end at Closed Won. The right side is half of the system.
Once you accept that frame, gross revenue retention stops being a customer success metric and starts being the right-hand acquisition leak. The renewal you lose this year was a deal you have to win again next year on top of your new logo target. Logo churn at 10% is not a CS dashboard line; it is 10% of next year’s quota added to the new business team’s target.
Treating revenue as a continuous loop — what we call the Figure-Eight in our own product because the bowtie flips around and feeds itself — is the strategic shift behind the Revenue Engine category. Revenue Architecture is the model. The engine is how you run it. And the first thing the engine does differently from a forecast dashboard is treat the right side of the bowtie with the same instrumentation as the left.
What this looks like in a Revenue Engine
Here is what splitting GRR by segment looks like operationally, using Summit53’s own demo data so the screenshots and the numbers stay truthful. The point is not to walk you through a product tour. The point is to show the shape of the cross-cut a CRO actually needs to see, and to be honest about how much of it is already absent from spreadsheets and forecast tools.
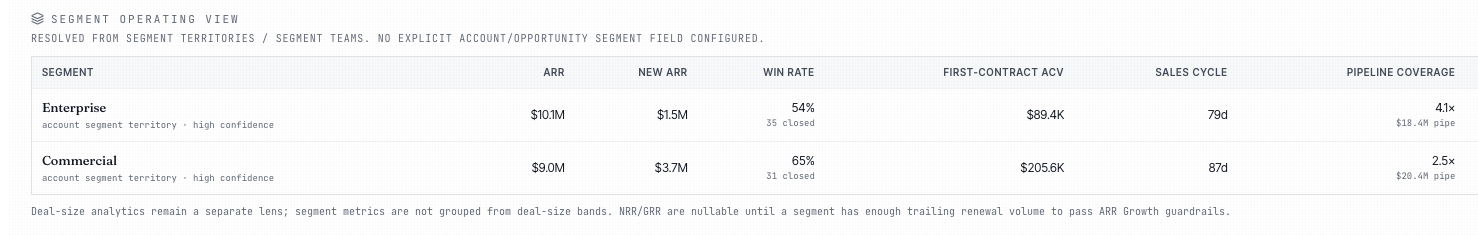
The Segment Operating View sits just below the bowtie hero on the Revenue Engine page. Eight columns by two segments. ARR, new ARR, win rate, first-contract ACV, sales cycle, pipeline coverage, capacity gap. The numbers in this view are not the point on their own. The point is that retention, win rate, and pipeline coverage live in the same table, segmented the same way. The CS leader and the sales leader are reading the same row of data, not three different spreadsheets.
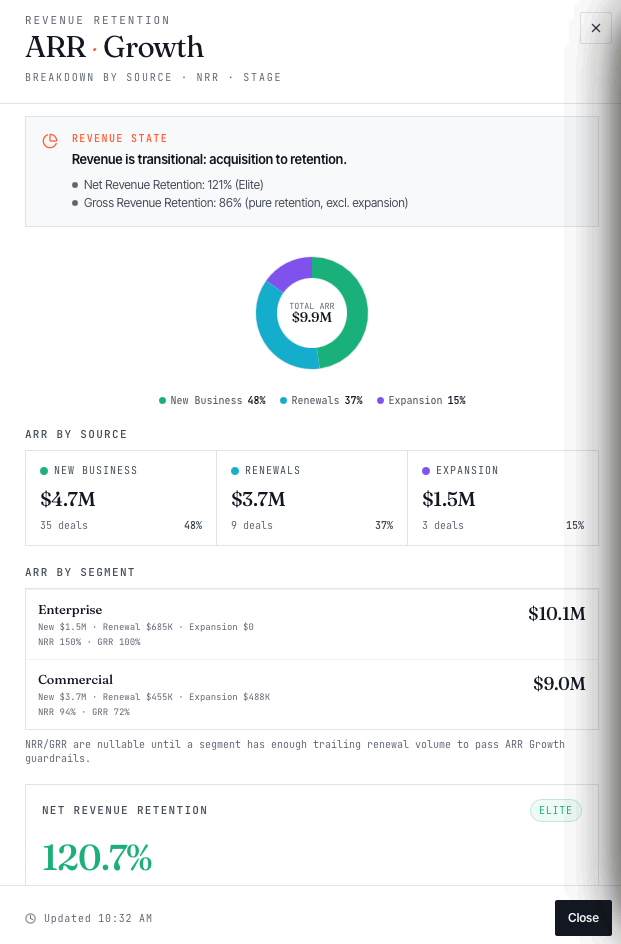
Click into the NRR cell on the masthead and the drilldown shows the decomposition. ARR by source (new business, renewals, expansion) on the donut. ARR by segment with per-segment NRR and GRR side by side. On the seed shown, enterprise sits at 150% NRR with 100% gross retention. Zero logo churn on the segment. Commercial is where the leak lives. Same blended GRR of 85.5%, but the prescription changes from fix retention to fix commercial-segment retention; enterprise is fine. Those are different conversations with different owners.
The drilldown also surfaces the leading indicators AJ’s argument depends on. Logo churn at 10% (one of ten renewal accounts). Time-to-value at 26 days median and 39 days at the 75th percentile. Growth-stage classification reading Transitional: Acquisition to Retention. Each of these is the upstream measurement that GRR is the lagging signature of. Both layers, on the same page, instrumented per segment.
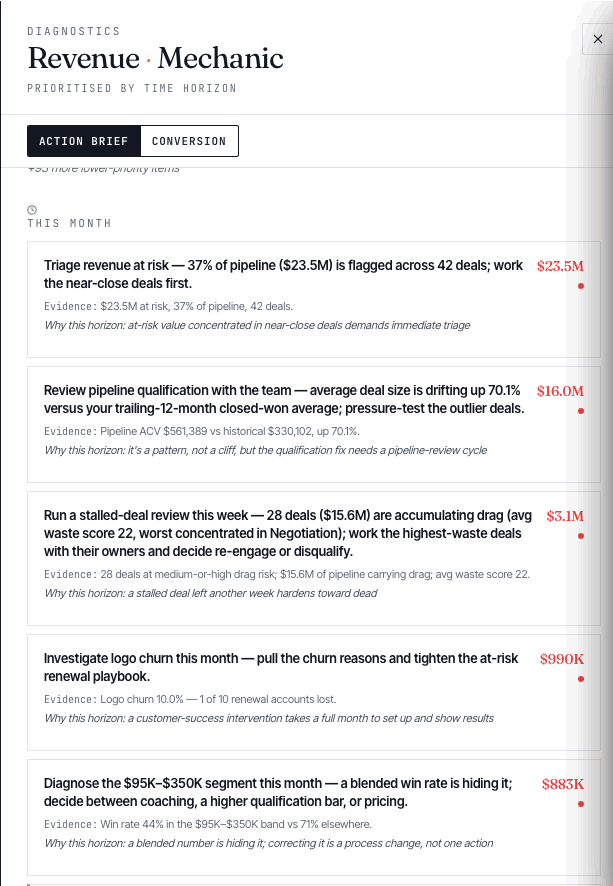
Underneath the drilldown sits the Revenue Mechanic, which translates the diagnosis into a horizoned action brief: what to do today, this week, this month, this quarter. On this seed, the single quarter-horizon card reads: Make gross retention a quarter priority — this is structural; it needs sustained onboarding and CS investment, not a single fix. $9.9M. Evidence: GRR 85.5%, below a healthy 90%. The Mechanic is opinionated on purpose. It refuses to surface gross retention as a weekly fire to put out and refuses to surface it as a single save-deal play. The recommendation is a quarter-altitude investment because retention is structural and a quarter is the cycle time for an onboarding-playbook change to show up in the data. The number with the dollar value attached is what the board cares about. The rationale on the card is what makes the recommendation operable.
This is the shape we mean when we describe Summit53 as a Revenue Engine platform. Not a forecast tool with a retention page bolted on. The Bowtie hero, the Segment Operating View, the ARR Growth drilldown, and the Revenue Mechanic are reading the same data model. The CRO, the VP Sales, the RevOps lead, and the CS leader are looking at the same source of truth with a persona-shaped lens on top. The conversation about gross retention by segment is no longer a spreadsheet someone’s analyst built; it is on the masthead.
What you do this quarter
You do not need a Revenue Engine platform to start the change. Four moves will do most of the work, in this order.
- Put GRR on the masthead, next to NRR. If you only have room for one retention number on the board slide, that is the choice you are making. Show both. Label NRR as the headline and GRR as the honest underline. The 2026 benchmark gap of 12 to 25 percentage points becomes a visible question rather than a hidden one.
- Split GRR by segment. Pick whatever segmentation your business actually runs on, whether that is enterprise vs commercial, ICP vs non-ICP, or industry vertical. The trap to avoid is letting the segmentation drift to whatever the CRM happens to tag. Choose the cut that maps to how your CS team is staffed and how your onboarding playbook differs. Then publish the per-segment GRR with the same cadence as the blended number.
- Instrument time-to-value as a leading indicator. AJ’s right: GRR is lagging. Median time-to-value (days from contract start to first impact evidence) and the 75th-percentile number above it are the upstream measurements that predict the downstream churn. They also segment cleanly. If your enterprise time-to-value is 21 days and your mid-market is 60, you have located the gap before it has cost you a renewal.
- Treat segment-level GRR remediation as a quarter-level investment, not a save-deal play. Chad Peets put the framing in one line: they’re not getting the value out of the product they thought they would. That is not solved by a heroic CSM sprint in week 12. It is solved by an onboarding playbook change, a CS staffing change, or a product surface that makes value visible. All of those are quarter-cycle investments. The Revenue Mechanic in our product flags it that way for a reason. The reason applies whether or not you are using our product.
The conversation gap
The enterprise revenue platforms — Clari, Gong, Outreach, named as Leaders in Gartner’s December 2025 Revenue Action Orchestration Magic Quadrant — handle the segment-level retention conversation for the teams that can afford the implementation. For the mid-market segment they explicitly do not serve, that conversation tends to live in a quarterly spreadsheet that the RevOps lead builds in a long Sunday afternoon every three months. It is the same data, presented the same way, with a four-month delay built in.
Closing that gap is what we mean when we talk about a mid-market Revenue Engine. The Bowtie’s right side instrumented to the same depth as the left. NRR and GRR side by side, per segment, on the page where the CRO already is. A Revenue Mechanic that calls the quarter-level investment by its name and attaches the number to it. Not a dashboard. A diagnosis with a prescribed cadence.
If you would like to see how this looks against your own retention data, get in touch. Founding Partner conversations are open through end of quarter, and the engine runs on real Salesforce data with read-only credentials. You can also explore the Revenue Engine page directly to see the Bowtie hero, the Segment Operating View, and the Revenue Mechanic alongside one another.
Buyer quotes are paraphrased from public podcast transcripts and retain their attribution where confirmable. The Glean and 20VC timestamps cited above carry caveats from our source recordings; if you cite them downstream, confirm against the original episode first. Benchmark figures in Section 2 are drawn from SaaS Capital, 2026 Benchmarking Metrics for Bootstrapped SaaS Companies. Sample populations vary across benchmark publishers; figures reproduced here are valid for the named source and should not be transposed to a different sample.