Introduction
Welcome to the Summit53 Pipeline Intelligence dashboard! This powerful tool provides sales leaders with real-time visibility into pipeline health, risk factors, and forecast confidence - ultimately helping you make data-driven decisions to improve win rates and manage your team more effectively.
This guide will help you understand how to use the Pipeline Intelligence features to maximize your sales leadership effectiveness, identify at-risk deals, and coach your team to success.
Accessing Pipeline Intelligence
You can access the Pipeline Intelligence dashboard by:
- Navigating to the CRM module in the main navigation
- Selecting "Pipeline Intelligence" from the dropdown menu
- Alternatively, bookmarking the direct URL:
/crm/pipeline-intelligence
Dashboard Overview
The Pipeline Intelligence dashboard is designed to give you an immediate view of your team's pipeline health with AI-powered risk analytics. Here's what you'll find:
Header Controls
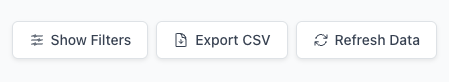
Header Controls: Filter, export, and refresh functions
The header section contains:
- Show/Hide Filters: Toggle filter panel visibility
- Export: Download pipeline data in CSV format
- Refresh: Update all data in real-time
Key Dashboard Components
The dashboard is organized into three primary sections:
- Forecast Confidence Overview: High-level metrics on forecast reliability
- Pipeline Risk Heatmap: Interactive table of opportunities with risk indicators
- Risk Triggers: Real-time alerts requiring immediate attention
Key Features in Detail
Forecast Confidence Overview
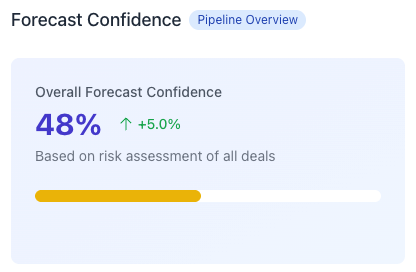
Forecast Confidence Overview: High-level metrics on forecast reliability
The Forecast Confidence section provides insights into the reliability of your team's current forecast:
Overall Confidence Score
A percentage score (0-100%) representing the AI assessment of your forecast accuracy based on all deals in the pipeline. The score considers:
- Sales methodology framework completion rates
- Contact risk factors
- Activity patterns
- Rep commitment levels
The trend indicator shows whether confidence is improving or declining compared to the previous period.
Total Pipeline Value
Displays the total forecast value and highlights the portion that's at risk. This helps you identify the gap between your current forecast and what's realistically attainable.
- Total Value: Sum of all opportunities in the pipeline
- At Risk: Dollar amount of deals flagged as high-risk
- Risk %: Percentage of total pipeline considered at risk
Pipeline by Risk Level
Breaks down the pipeline into three risk categories, showing both the amount and percentage of your total pipeline in each category:
- Low Risk (green): Deals with strong qualification and healthy progression
- Medium Risk (yellow): Deals showing some warning signs that need attention
- High Risk (red): Deals with significant risk factors that require immediate intervention
Forecast Confidence by Rep
A table showing each sales rep's pipeline value and confidence score. This helps you identify which team members may need coaching on pipeline management or deal qualification.
- Reps with low confidence scores may need help with qualification or forecasting discipline
- Reps with high pipeline values but low confidence scores represent the highest coaching priority
Pipeline Risk Heatmap
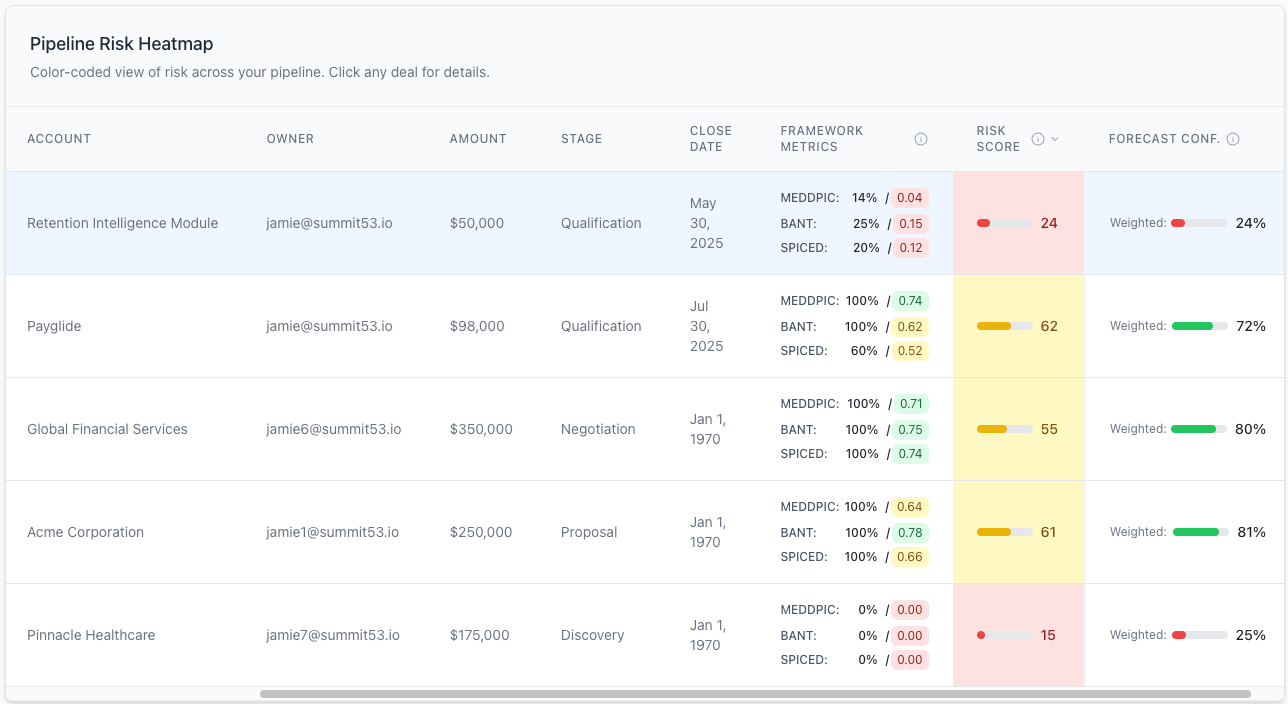
Pipeline Risk Heatmap: Color-coded view of all deals with risk indicators
The Pipeline Risk Heatmap provides a comprehensive view of all opportunities in your pipeline with color-coded risk indicators. This allows you to quickly identify which deals need attention.
Heatmap Features
- Sortable Columns: Click any column header to sort by that field
- Risk Score Indicator: Visual indicator of deal health (0-100)
- Forecast Confidence: Probability of closing as forecasted
- Color Coding:
- Green (70-100): Healthy deals with strong qualification
- Yellow (40-69): Deals with moderate risk requiring attention
- Red (0-39): High-risk deals needing immediate intervention
- Deal Selection: Click any row to view detailed information about that opportunity
Pro Tip: Sort by Risk Score (lowest first) to quickly identify your most at-risk opportunities.
Deal Details Panel
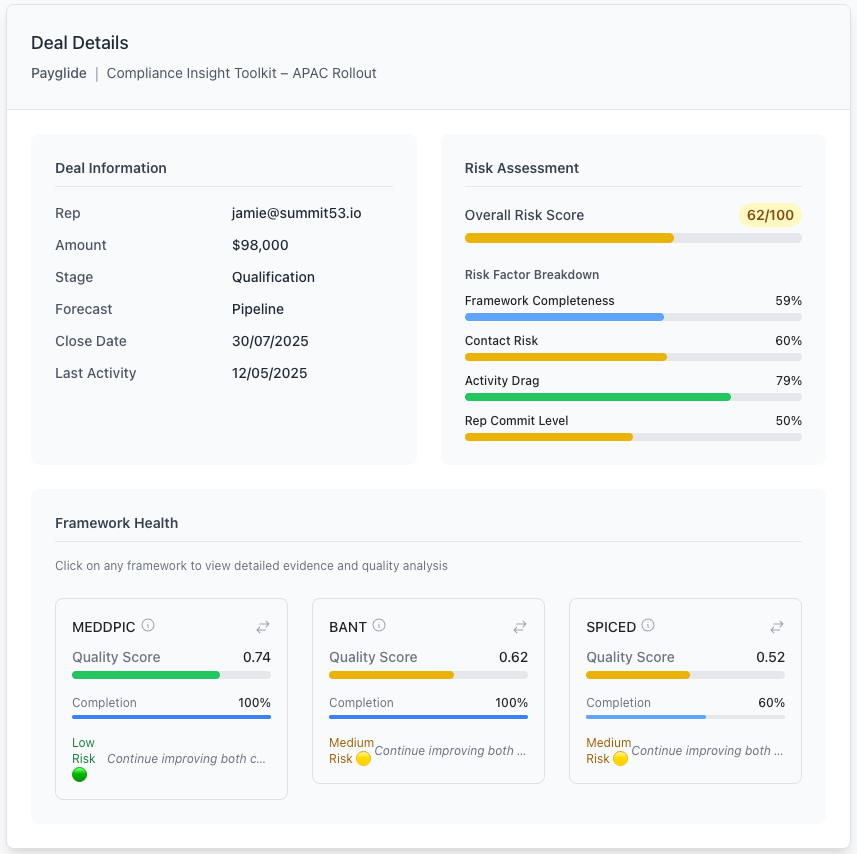
Deal Details Panel: Comprehensive view of selected opportunity
When you select a deal from the heatmap, the Deal Details panel displays comprehensive information about that opportunity:
Deal Information
Basic details about the selected opportunity:
- Rep name
- Deal amount
- Current stage
- Forecast category
- Close date
- Last activity date
Risk Assessment
Detailed breakdown of risk factors:
- Overall Risk Score: Composite score (0-100)
- Framework Completeness: Sales qualification framework usage
- Contact Risk: Assessment of stakeholder coverage and engagement
- Activity Drag: Analysis of deal momentum based on activities
- Rep Commit Level: Rep's own confidence in the deal
Framework Health
Displays completion percentages for the three sales qualification frameworks. This helps identify if the rep is properly qualifying the opportunity:
- MEDDPIC: Complex enterprise sales methodology
- BANT: Basic qualification framework
- Three WHYs: Customer motivation analysis
Risk Triggers
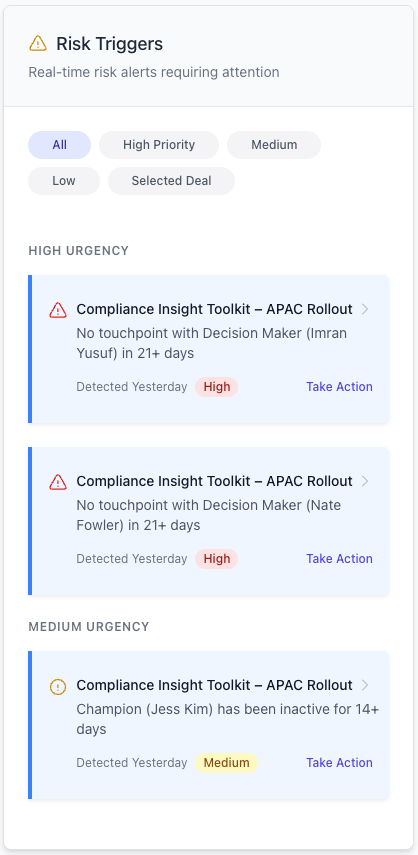
Risk Triggers Panel: Real-time alerts requiring attention
The Risk Triggers panel displays real-time alerts for issues detected in your pipeline. These are actionable notifications that help you proactively address problems:
Trigger Categories
Triggers are categorized by urgency level:
- High Urgency (red): Critical issues requiring immediate attention
- Medium Urgency (yellow): Important issues to address soon
- Low Urgency (blue): Informational alerts for awareness
Trigger Filtering
Use the filter buttons at the top of the panel to focus on specific trigger types:
- All: Show all triggers
- High Priority: Only critical issues
- Medium: Only medium urgency issues
- Low: Only low urgency informational alerts
- Selected Deal: Only triggers for the currently selected opportunity
Trigger Actions
For each trigger, you can:
- Click on the trigger to view the associated opportunity details
- Click "Take Action" to address the specific issue
Common Trigger Types
- Stale Opportunity: No activity in the last 14+ days
- Missing Decision Maker: No identified economic buyer
- Framework Incomplete: Key qualification elements missing
- Close Date Slipped: Close date moved multiple times
- Competitive Threat: New competitor identified
- Stage Misalignment: Stage doesn't match qualification level
- Activity Pattern Warning: Unusual activity patterns compared to successful deals
Working with Filters
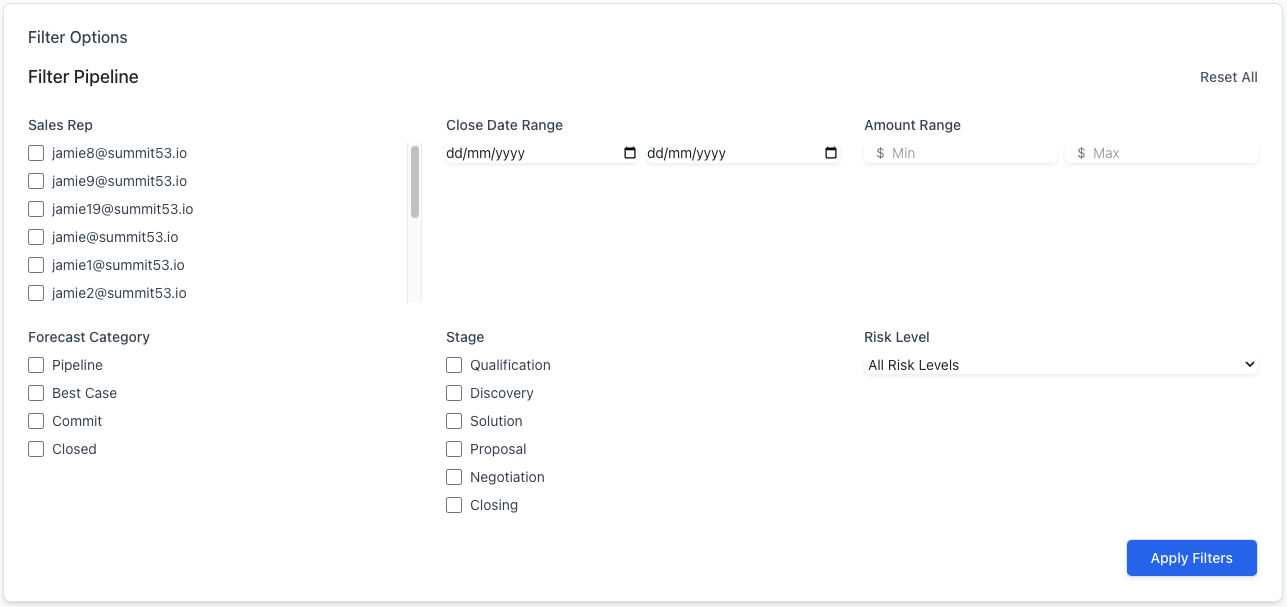
Pipeline Filters Panel: Customizing your pipeline view
The Pipeline Intelligence dashboard includes powerful filtering capabilities to help you focus on specific segments of your pipeline:
Available Filters
- Sales Rep: Filter by specific team members
- Close Date Range: Focus on deals closing within a specific timeframe
- Amount Range: Filter by deal size
- Forecast Category: Filter by Pipeline, Best Case, Commit, or Closed
- Stage: Filter by sales process stage
- Risk Level: Filter by High, Medium, or Low risk
Using Filters
- Click "Show Filters" in the header to display the filter panel
- Select your desired filter criteria
- Click "Apply Filters" to update the dashboard
- Applied filters will appear as tags below the filter panel
- Click the X on any filter tag to remove that filter
- Click "Reset All" to clear all filters
Common Filter Use Cases
- Rep Performance: Filter by rep to focus on an individual's pipeline
- Quarter Close: Set date range to current quarter to focus on near-term deals
- Large Deals: Set minimum amount to focus on high-value opportunities
- At-Risk Forecast: Filter by "Commit" forecast category and "High" risk level to identify committed deals at risk
- Late-Stage Issues: Filter by late stages and medium/high risk to identify problems in deals nearing close
Leadership Actions
The Pipeline Intelligence dashboard is designed to help you take specific actions to improve your pipeline health:
Identifying Coaching Opportunities
- Review Rep Confidence Scores: Identify reps with low forecast confidence
- Analyze Framework Completion: Look for patterns of incomplete qualification
- Track Risk Triggers by Rep: Identify which reps have recurring risk patterns
- Examine Stale Deals: Look for reps who aren't maintaining activity momentum
Deal Review Preparation
- Filter to the specific rep's pipeline before a 1:1 deal review
- Sort by risk score to identify which deals to focus on
- Review the risk factors for those deals to prepare specific questions
- Check the framework health to identify qualification gaps
- Note any risk triggers to discuss with the rep
Forecast Adjustment
- Use the overall confidence score to assess if your forecast needs adjustment
- Focus on the "At Risk" amount to quantify potential forecast reduction
- Review high-risk, high-value deals to determine if they should be pushed out
- Examine reps with low confidence scores for potential overforecasting
Quarterly Business Review Preparation
- Export pipeline data for inclusion in QBR materials
- Analyze risk distribution across the pipeline
- Identify systemic issues (e.g., consistent framework completion problems)
- Create action plans based on recurring risk triggers
Best Practices
Establish a Regular Review Cadence
- Daily: Quick review of new high-priority risk triggers
- Weekly: Comprehensive review of at-risk deals and forecast confidence
- Monthly: Deep dive into pipeline trends and rep-specific patterns
- Quarterly: Strategic analysis and action planning for systematic issues
For guided team actions based on these insights, open the Pipeline Playbook.
Drive Team Alignment
- Share filtered pipeline views with the team to highlight focus areas
- Use risk scores in team meetings to objectively discuss deal health
- Establish minimum framework completion requirements based on deal size
- Create team competitions around reducing risk triggers
- Recognize reps who maintain high forecast confidence scores
Continuous Improvement
- Track changes in overall confidence score over time
- Correlate risk factors with actual win/loss outcomes
- Identify which risk triggers are most predictive of deal outcomes
- Adjust coaching focus based on most impactful risk factors
Guidance for Account Executives
While Pipeline Intelligence is primarily designed for sales leaders, Account Executives can also benefit from these insights:
Self-Assessment
- Review your personal risk heatmap to identify your most at-risk deals
- Pay close attention to risk triggers as early warning signs
- Use framework health scores to guide your qualification efforts
- Align your forecast categories with objective risk scores
Preparing for Coaching
- Before meeting with your manager, review your risk scores
- Prepare explanations for any high-risk deals in your commit category
- Identify qualification gaps you need help addressing
- Create action plans for addressing risk triggers
Getting Help
If you need assistance with Pipeline Intelligence:
- Contact your Sales Operations team for technical questions
- Refer to the Summit53 knowledge base for additional guidance
- Schedule time with your RevOps leader for advanced analysis
The Pipeline Intelligence dashboard is a powerful tool that transforms your CRM data into actionable insights. By systematically reviewing these metrics and acting on the recommendations, you'll be able to improve forecast accuracy, identify and save at-risk deals, and coach your team more effectively.
Appendix: Glossary of Terms
- Risk Score: AI-generated measure of deal health (0-100)
- Forecast Confidence: Probability that a deal will close as forecasted
- Framework Completeness: Percentage of sales qualification framework elements completed
- Contact Risk: Assessment of stakeholder coverage and engagement
- Activity Drag: Analysis of deal momentum based on activities
- Rep Commit Level: Rep's own confidence in the deal
- Risk Trigger: Specific warning flag requiring attention
- MEDDPIC: Complex enterprise sales qualification framework
- BANT: Basic qualification framework (Budget, Authority, Need, Timeline)
- Three WHYs: Methodology for understanding customer motivation